In this blog post about autoscaling with Prometheus and Spring Boot in Kubernetes, we will explore how to implement custom autoscaling based on different metrics using Kubernetes’ Horizontal Pod Autoscaler (HPA). By default, Kubernetes’ HPA scales pods based on CPU and memory metrics, which may not be sufficient for some use cases. In our example, we will use Prometheus through Spring Boot’s actuator to obtain different metrics and perform scaling based on these metrics.
While the default Kubernetes autoscaler provides two of the most commonly used metrics (CPU and memory), it may not be sufficient for horizontal scaling in some cases. This is why they created the autoscaling/v2beta2 version, which includes autoscaling based on custom metrics. For example, you can scale based on the number of requests per second and create new replicas if you exceed a threshold. In these cases, Prometheus through Spring Boot actuator will help us collect these metrics.
Auto Scaling in Kubernetes with Prometheus and Spring Boot
The Kubernetes Horizontal Pod Autoscaler automatically scales the number of Pods in a replication controller, deployment, replica set, or stateful set based on CPU, memory usage, or other predefined metrics.
To carry out our auto-scaling example with Spring Boot, we will deploy an instance of our application to Kubernetes. Prometheus will start collecting metrics through the actuator endpoint. Depending on the number of requests configured, we will observe horizontal scaling of our Pods.
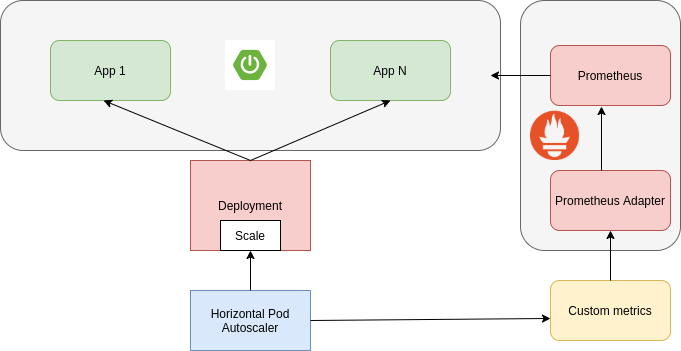
In the diagram above, we can see the architecture that we will apply in our example. On one side, we have an application built in Spring Boot, to which we will add Prometheus and Actuator dependencies to expose metrics. On the other side, we have Kubernetes’ Horizontal Pod Autoscaler, which, based on metrics obtained through Prometheus, will perform Pod scaling. The Prometheus adapter is necessary because it acts as an intermediary, meaning it collects and exposes metrics.
Kubernetes scaling is based on a formula:
desiredReplicas = ceil[currentReplicas * ( currentMetricValue / desiredMetricValue )]
This formula indicates the total number of replicas we want to have, which will be the maximum number, obtained by multiplying the current number of replicas by the current value of the metric divided by the desired value. For example, if the current metric value is 200m, the desired value is 100, and we have only one replica, the calculation will be 1 * (200 / 100) = 2.
Hands On
Next, we are going to start with the necessary steps to set up Auto Scaling with Spring Boot in Kubernetes. To do that, we will begin by deploying Prometheus on our Kubernetes cluster. For this, we will be using the official Prometheus repository through Helm Chart:
Helm uses a packaging format called charts. A chart is a collection of files that describe a related set of Kubernetes resources. You can use a single chart to deploy something simple, such as a caching module, or something complex, like a set of applications that utilize different resources, as is the case in this article with Prometheus.
helm repo add prometheus-community https://prometheus-community.github.io/helm-charts
helm repo add stable https://charts.helm.sh/stable
helm repo update
helm install prometheus prometheus-community/prometheus
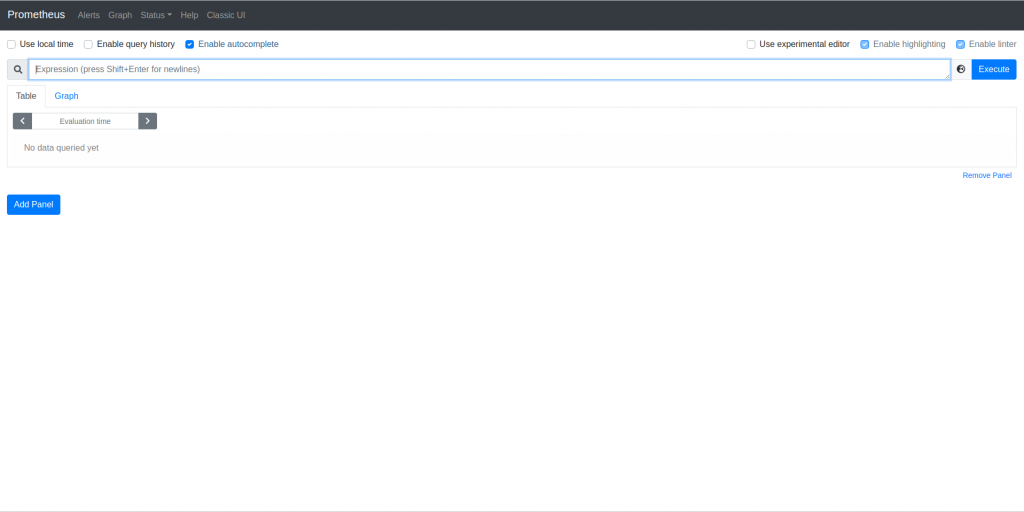
Once we have entered the previous commands, Prometheus will be installed on our Kubernetes cluster. The next step is to create a port forward to port 9090 for the Prometheus server pod, allowing us to run tests from our local environment:
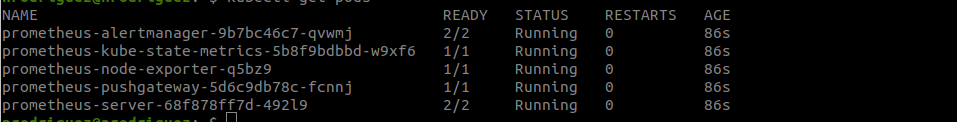
kubectl port-forward prometheus-server-68f878ff7d-492l9 9090:9090
This way, we can run our Spring Boot application locally and connect to Prometheus.
Maven dependencies
Next, we are going to create a simple Spring Boot application where, using Prometheus and Actuator dependencies, we will connect to our Prometheus instance installed in Kubernetes.
The first thing we need to do is add the Maven dependencies to our application:
<dependency>
   <groupId>org.springframework.boot</groupId>
   <artifactId>spring-boot-starter-actuator</artifactId>
</dependency>
<dependency>
   <groupId>io.micrometer</groupId>
   <artifactId>micrometer-registry-prometheus</artifactId>
</dependency>
The aforementioned dependencies are the only ones required to connect to Prometheus through /actuator/prometheus.
Data Base dependencies
		<dependency>
			<groupId>org.springframework.boot</groupId>
			<artifactId>spring-boot-starter-data-jpa</artifactId>
		</dependency>

		<dependency>
			<groupId>com.h2database</groupId>
			<artifactId>h2</artifactId>
			<scope>runtime</scope>
		</dependency>
Building a Spring Boot Application with Prometheus
Starting from the Spring Boot project we have created, we will create a controller that will connect to an in-memory H2 database to integrate and connect it with the Prometheus instance we have deployed in our Kubernetes.
You can download the complete code from here if you wish.
@RestController
@RequestMapping("/cars")
@RequiredArgsConstructor
public class CarController {

    private final CarRepository carRepository;

    @GetMapping
    public ResponseEntity<Iterable<Car>> findAllCars() {
        return ResponseEntity.ok().body(carRepository.findAll());
    }

    @GetMapping("/{id}")
    public ResponseEntity<Car> findCarById(@PathVariable("id") String id) {
        return ResponseEntity.ok().body(carRepository.findById(UUID.fromString(id)).orElseThrow());
    }

    @PutMapping
    public ResponseEntity<Car> updateCar(@RequestBody Car car) {
        return new ResponseEntity<>(carRepository.save(car),HttpStatus.CREATED);
    }

    @PostMapping
    public ResponseEntity<Car> addCar(@RequestBody Car car) {
        return new ResponseEntity<>(carRepository.save(car),HttpStatus.CREATED);
    }

    @DeleteMapping("/{id}")
    public void deleteCar(@PathVariable("id") String id) {
        carRepository.deleteById(UUID.fromString(id));
    }
}
Next, we add the repository:
public interface CarRepository extends JpaRepository<Car, UUID> {

}
And finally, the database entity that corresponds to the output object:
@Entity
@AllArgsConstructor
@NoArgsConstructor
@Getter
@Setter
public class Car {

    @Id
    @GeneratedValue
    private UUID id;

    private String model;

    private String brand;

    private String color;

    private String type;
}
It is crucial to specify through the properties of our application (application.yml) that we will expose metrics:
spring:
  application:
    name: kubernetes-custom-autoscaler

management:
  endpoints:
    web:
      exposure:
        include: "*"
Deploy a Spring Boot Application with Prometheus on Kubernetes
Once we have created our Spring Boot application, we are going to deploy it in Kubernetes. To do that, the first step is to create the Docker image.
If you are using Kubernetes locally with Minikube, don’t forget to add:
eval $(minikube -p minikube docker-env)
To create the image with Spring Boot using Maven, we use the following command:
mvn spring-boot:build-image
Once we have the image created, it’s time to create the deployment.yaml:
apiVersion: apps/v1
kind: Deployment
metadata:
  creationTimestamp: null
  labels:
    app: spring-boot-kubernetes-autoscaler
  name: spring-boot-kubernetes-autoscaler
spec:
  replicas: 1
  selector:
    matchLabels:
      app: spring-boot-kubernetes-autoscaler
  template:
    metadata:
      creationTimestamp: null
      labels:
        app: spring-boot-kubernetes-autoscaler
      annotations:
        prometheus.io/path: /actuator/prometheus
        prometheus.io/scrape: "true"
        prometheus.io/port: "8080"
    spec:
      containers:
      - image: kubernetes-custom-autoscaler:0.0.1-SNAPSHOT
        name: spring-boot-kubernetes-autoscaler
        ports:
        - containerPort: 8080
The previous deployment is quite common except for the part with annotations within metadata. At this point, we specify the communication to the pod with Prometheus metrics.
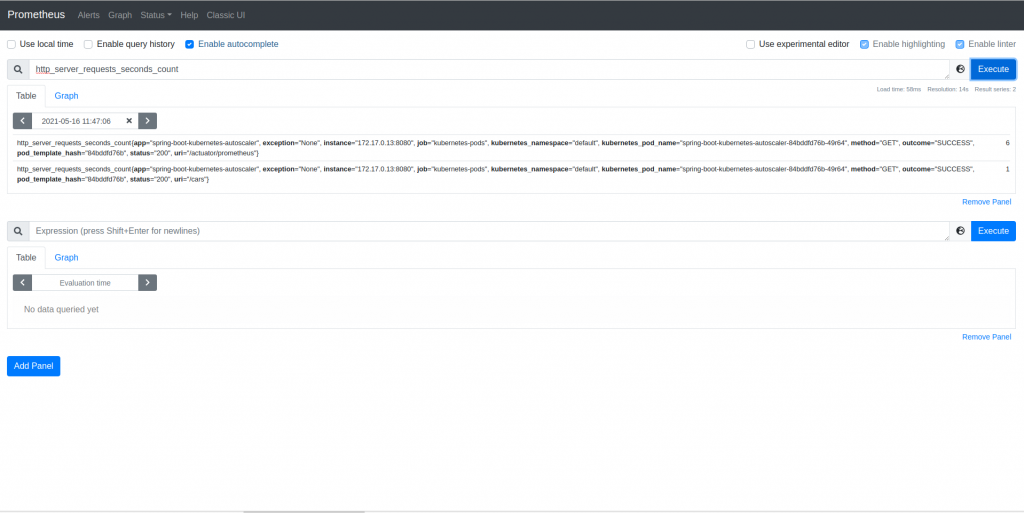
Once the pod has been created, we can establish a port forward with the pod, and we will see the communication with Prometheus. If you make the following request to localhost:8080/cars and check in Prometheus, you’ll see that a request is being made:
Connect Prometheus with the adapter
Once the application is deployed and Prometheus is collecting metrics, it’s necessary to connect it to the adapter that acts as a bridge to the Kubernetes metrics API. In this adapter we’re going to create, we’ll add the metric we want to control, which is http_server_requests_seconds_count. This adapter will create a ConfigMap, a Deployment, and a Service using Helm. To do this, we’ll make a small modification by adding a rule and specifying the port and URL for Prometheus.
In the rule we are adding, we instruct it to override the namespace and the pod required to collect metrics from Prometheus. To do this, run the following file:
prometheus:
  url: http://prometheus-server.default.svc
  port: 80
  path: ""

rules:
  default: true
  custom:
    - seriesQuery: '{__name__=~"^http_server_requests_seconds_.*"}'
      resources:
        overrides:
          kubernetes_namespace:
            resource: namespace
          kubernetes_pod_name:
            resource: pod
      name:
        matches: "^http_server_requests_seconds_count(.*)"
        as: "http_server_requests_seconds_count_sum"
      metricsQuery: sum(<<.Series>>{<<.LabelMatchers>>,uri=~"/cars.*"}) by (<<.GroupBy>>)
To run the above file, use:
helm install -f helm-prometheus.yaml prometheus-adapter prometheus-community/prometheus-adapter
If you make any mistakes, you can perform an update with the following command:
helm upgrade --install -f helm-prometheus.yaml prometheus-adapter prometheus-community/prometheus-adapter
If you then run the following command, you can see the metrics and the associated pod:
kubectl get --raw "/apis/custom.metrics.k8s.io/v1beta1/namespaces/default/pods/*/http_server_requests_per_second" | jq .
Once the adapter is functioning and configured, it’s time to create a Horizontal Pod Autoscaler, which is a Kubernetes object type that will create new replicas based on specific values.
Horizontal Pod Autoscaler in Kubernetes for Prometheus
To create our HorizontalPodAutoscaler, we will use version autoscaling/v2beta2, as this version includes custom metrics. This object associates with a deployment, in our case, the deployment we created to run our Spring Boot application. Once the number of requests exceeds the threshold we’ve set, it will create new replicas.
apiVersion: autoscaling/v2beta2
kind: HorizontalPodAutoscaler
metadata:
  name: spring-boot-prometheus-autoscaler
  namespace: default
spec:
  scaleTargetRef:
    apiVersion: apps/v1
    kind: Deployment
    name: spring-boot-kubernetes-autoscaler
  minReplicas: 1
  maxReplicas: 5
  metrics:
    - type: Pods
      pods:
        metric:
          name: http_server_requests_seconds_count_sum
        target:
          type: AverageValue
          averageValue: 10
Next, we execute the HPA (Horizontal Pod Autoscaler) with the following command:
kubectl apply -f HorizontalPodAutoscaler.yaml
We execute the command to verify that it has been created successfully:
kubectl get hpa
and after a few requests, it should start creating replicas, and you should see something like this:

What we can see in the previous image is that we have executed a request 91 times against the Spring Boot service. So, once it reaches 10, a new replica is created, reaching the maximum limit set at 5.
Now that we have seen how to create a horizontal scaler with custom metrics in Kubernetes, let’s proceed to delete everything we have created in the working environment.
helm uninstall prometheus
helm uninstall prometheus-adapter
kubectl delete hpa spring-boot-prometheus-autoscaler
kubectl delete deployment spring-boot-kubernetes-autoscaler
kubectl delete svc spring-boot-kubernetes-autoscaler
Conclusion
One of the most essential tools or utilities in microservices architectures is the ability to utilize horizontal autoscaling. Kubernetes makes this task easier through its Horizontal Pod Autoscaler for CPU, memory, and custom metrics. By using Spring Boot Actuator and Prometheus, we can create a custom autoscaler for the number of requests made by an application.
If you want to download this example, about AutoScaling with Prometheus and Spring Boot in Kubernetes, along with the Kubernetes files, you can do so from our GitHub repository.