Currently, one of the most powerful and widely used paradigms is the development or architecture focused on Microservices. Just as different design patterns have emerged to implement and carry out a microservices and cloud-oriented architecture, patterns have also emerged to ensure that our development is functioning as it should. The post discusses three cloud and microservices-oriented patterns: monitoring, logging, and alerts, for achieving observability in a microservices architecture.

Monitoring
Microservices architectures can grow rapidly, which is why we need to know that everything is functioning correctly. We not only need to know if they fail, but also if our system is degrading or, for example, if we are unable to meet certain SLAs (Service Level Agreements). Monitoring our system will provide constant metrics and values to analyze its proper functioning.
What should we do with the monitoring data?
Our systems will provide a large amount of data that we will have to process and understand in some way. For example, if our system is about tax payments, and the normal behavior is processing 5000 tax payments per hour, and suddenly we only have 100, we might suspect that there is a problem.
In these cases, we could have platform metrics about average times, the slowest and fastest database requests, or the processing that started and finished correctly.
These metrics, for example, can be exploited in a dashboard that helps us understand the performance and behavior of our infrastructure at a low level. These metrics will help us determine if the system or performance is degrading and could cause the system to fail. It is important to use low-level data to help us prevent any failures before they occur.
Logging
Logging is one of the important factors in Observability in a Microservices Architecture. Any programming language allows us to write logs to understand how our application works. Generally, these logging libraries allow writing different log levels, such as WARN, INFO, DEBUG, ERROR.
These different log levels provide different levels of granularity when tracing any errors in our system. Enabling error trace level displays messages where errors may have occurred, such as points where exceptions are thrown. Generally, we use different log levels to capture errors or debug the application.
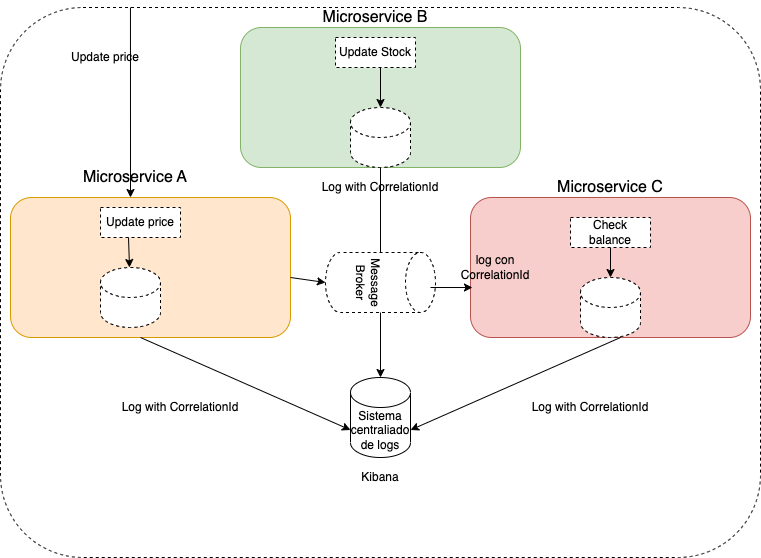
The use of clouds and microservices-oriented architectures drives the search for a centralized logging system that allows querying or exploiting logs from different microservices or system parts in one place. Some examples of systems to exploit logs are Kibana, an Elastic tool that helps us monitor and obtain real-time information.
Traceability in logs
Tracking calls between services is crucial in microservices architecture to identify invokers and their origins. For this purpose, we can add a Correlation ID, which is an identifier that allows us to obtain all the related messages of a service invocation.
There are different initiatives regarding correlation between microservices, such as the Spring Cloud Sleuth library, which allows us to obtain this correlation between microservices and is based on Zipkin.
Alerts
Having an alert system is necessary and essential in a system where each part functions as a cog with another part.
Alerts should be systems that warn us when something is failing or going wrong. For example, alerts can be created to notify when a status code 500 is returned, indicating an internal server error. When an error is detected, a notification should be sent to those responsible for monitoring or system owners to investigate what might have happened. The previously mentioned components will be used for investigation.
But what if our detection system is configured at a low level and sends an alert constantly? In these cases, it will be very difficult to detect the source of the problem. Therefore, in general, it is better to establish an error threshold by calculating an average of errors. For example, if we establish that we should send an alert for every 500 error, we could end up receiving too many alerts, which would hinder the final detection of the error.
Conclusion
In this post, we have seen three patterns to follow regarding Observability in a Microservices Architecture. Currently, with our applications or systems focused on the cloud and microservices, it is becoming increasingly important to have a well-established observability system.
