In this new post, following the article we previously saw about Spring Boot Actuator, we will explore Spring Boot Actuator Metrics with Prometheus and Grafana.
First of all, let’s talk a bit about Prometheus and Grafana.
What is Prometheus?
Prometheus is an open-source monitoring system that provides the following features:
- A simple and intuitive user interface for metric visualization and configuration.
- Time-series databases to store all metrics.
- Precise alert definition.
- Integration capabilities using libraries.
- The system configures information with a time interval to dump and save it.
What is Grafana?
Grafana is an open-source software project that allows us to visualize and analyze metrics. We can create dashboards and charts from different data sources and time-series databases such as Graphite, InfluxDB, OpenTSDB, ElasticSearch, or Prometheus.
Spring Configuration
Add Prometheus Dependency in our Pom.xml
Before adding Prometheus configuration, make sure you have a properly configured Spring Boot project with Actuator.
As we mentioned in our previous Spring Boot Actuator post, Spring uses Micrometer to integrate metrics with external monitoring systems. To do this, we need to add the following dependency to our Spring Boot application’s Pom.xml:
<dependency>
  <groupId>io.micrometer</groupId>
  <artifactId>micrometer-registry-prometheus</artifactId>
  <version>${micrometer.version}</version>
</dependency>
Once we add this dependency, Prometheus will be auto-configured to export metrics that can be consumed by a Prometheus server.
By adding this dependency, PrometheusMeterRegistry and a CollectorRegistry are added and configured. From this point on, our metrics will be available through Spring Boot Actuator via the /actuator/prometheus endpoint. Prometheus will scrape the metrics continuously.
To enable this new endpoint, it should be activated as follows:
management.endpoint.prometheus.enabled=true management.metrics.export.prometheus.enabled=true
If you are using Spring Boot 2, you need to activate the actuator endpoints in your properties file.
Prometheus Endpoint in Spring Boot Actuator
Through the endpoint http://localhost:8080/actuator, we can see all the metrics we have:
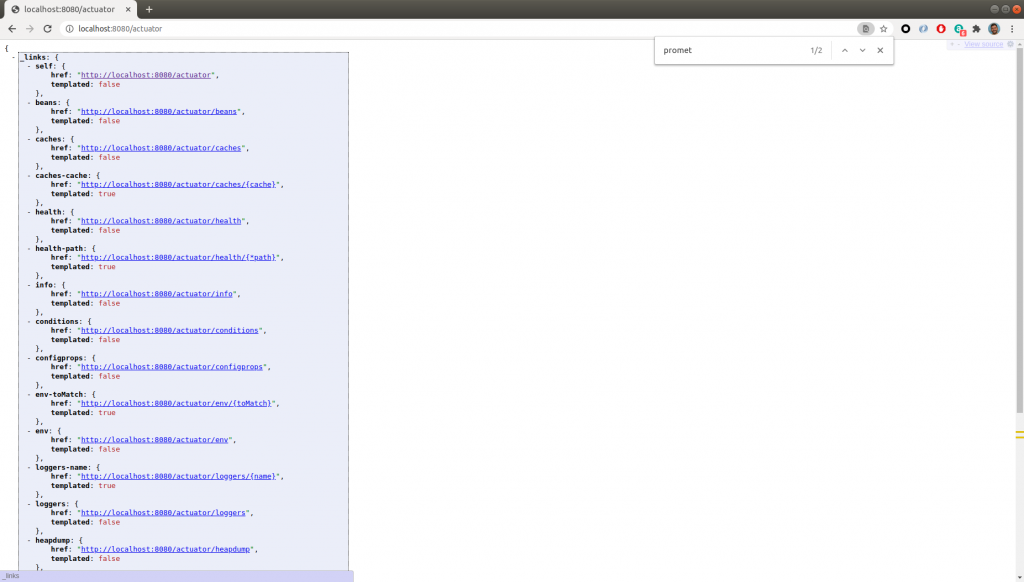
The above image shows all the actuator endpoints. To visualize them, as not all of them are active by default, they need to be activated as follows:
management.endpoint.metrics.enabled=true management.endpoints.web.exposure.include=*
Now, let’s activate Prometheus in our application, as we mentioned in the previous point:
management.endpoint.prometheus.enabled=true management.metrics.export.prometheus.enabled=true
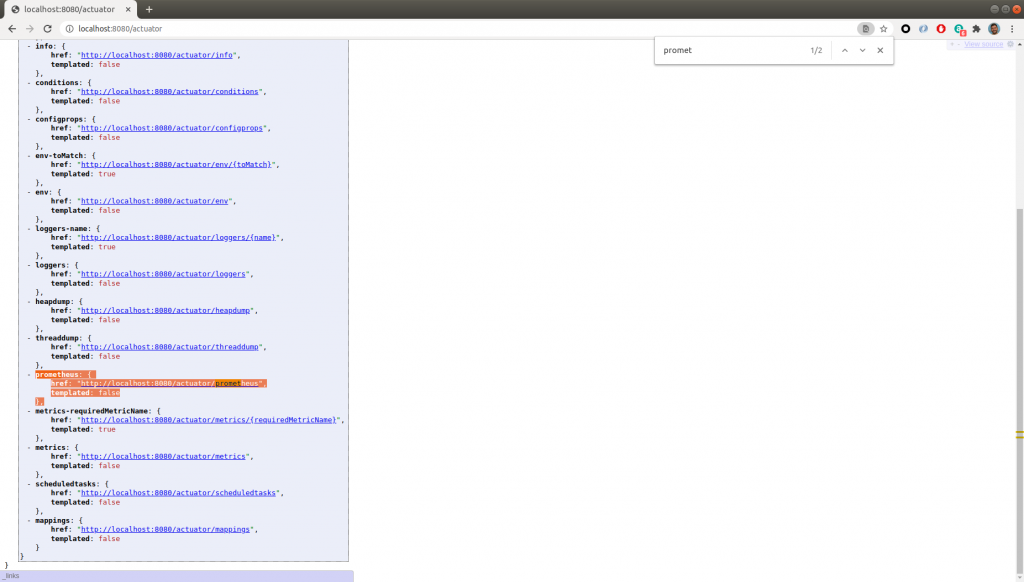
Now, when we execute the /actuator endpoint again, we can see that Prometheus has added metrics, which we can access through the link http://localhost:8080/actuator/prometheus.
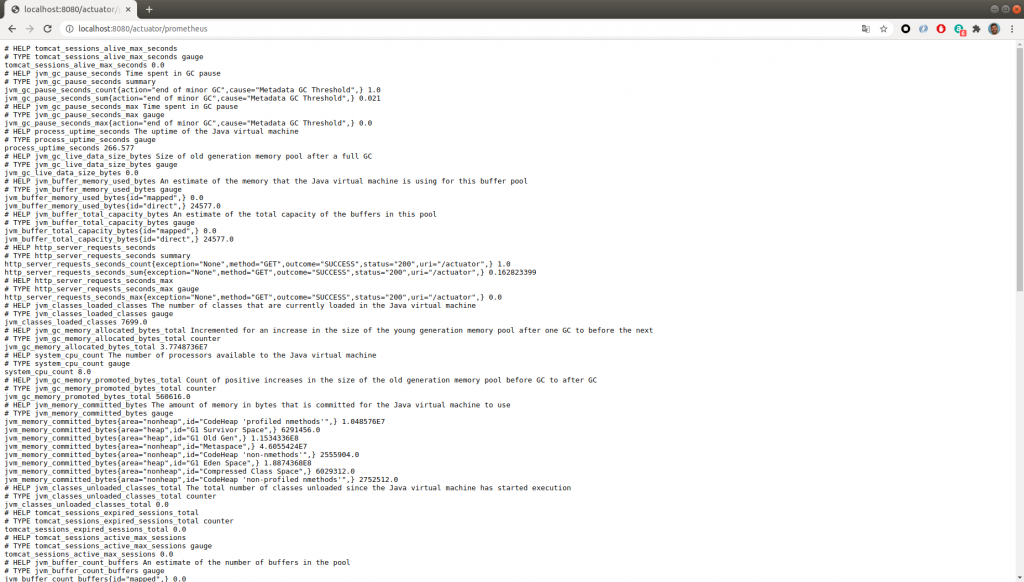
Once we execute the actuator endpoint for Prometheus, we can see all the metrics that will be dumped.
Configuring Prometheus and Grafana with Spring Boot
Configure Prometheus
Download Prometheus Image
To continue with the Prometheus configuration with Spring, the first step is to download a Docker image:
$ docker pull prom/prometheus
Edit the Prometheus YML
Let’s create a new file named prometheus.yml, where we will set the configuration for Prometheus to analyze Spring Boot Actuator metrics and the scrape interval:
global:
  scrape_interval:     15s # El intervalo en el que se traerá las métricas
  evaluation_interval: 15s # Evaluará las reglas cada 15 segundos, por defecto es cada minuto

# Se cargarán las reglas una vez y cada tiempo establecido en evaluation-interval serán analizadas
rule_files:
  # - "rule_A.yml"
  # - "rule_B.yml"


# Una configuración para poder capturar(scrape) las métricas tiene un endpoint:
scrape_configs:
  # El nombre del job se añade como como una etiqueta.
  - job_name: 'prometheus'

    # Sobreescribimos el scrape global por defecto cada 5 segundos.
    scrape_interval: 5s

    static_configs:
      - targets: ['127.0.0.1:9090']

  # Detalles para conectar Prometheus con Spring Boot Actuator y poder capturar las métricas
    - job_name: 'spring-actuator'

    # Endpoint de actuator.
    metrics_path: '/actuator/prometheus'

    #Con que frecuencia se hará scrape
    scrape_interval: 5s

    #el endpoint final, en nuestro caso usamos docker, pero sino usas docker será localhost por ejemplo, o el HOST en el que lo tengas configurado
    #localhost sino se usa DOCKER
    static_configs:
    - targets: ['HOST_IP:8080']
The above file has been created based on Prometheus documentation. As an important note, mentioned above in the file, please make sure to replace HOST_IP with the IP of the host where your Spring application is located.
Starting Prometheus
Next, let’s start Prometheus with the Prometheus.yml file we created. We will pass it as a parameter.
$ docker run -d --name=prometheus -p 9090:9090  -v <PATH/prometheus.yml>:/etc/prometheus/prometheus.yml  prom/prometheus --
config.file=/etc/prometheus/prometheus.yml
Viewing Metrics in Prometheus
With the Prometheus image up and running, along with our Prometheus configuration, let’s open our browser and go to the URL localhost:9090.
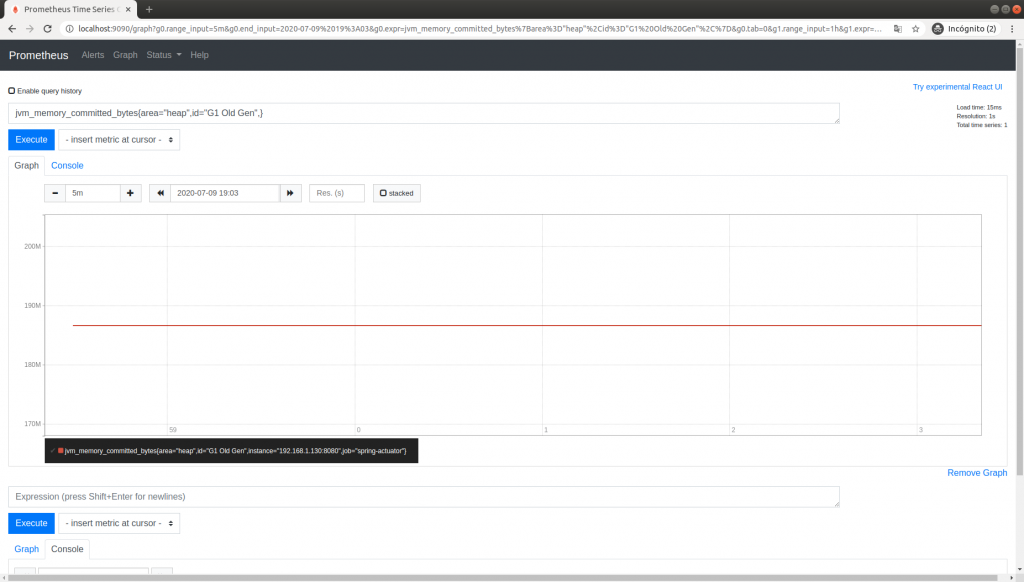
If you can’t see anything, it could be due to misconfiguration. It’s best to check the status/target option in the top menu and make sure everything is UP.
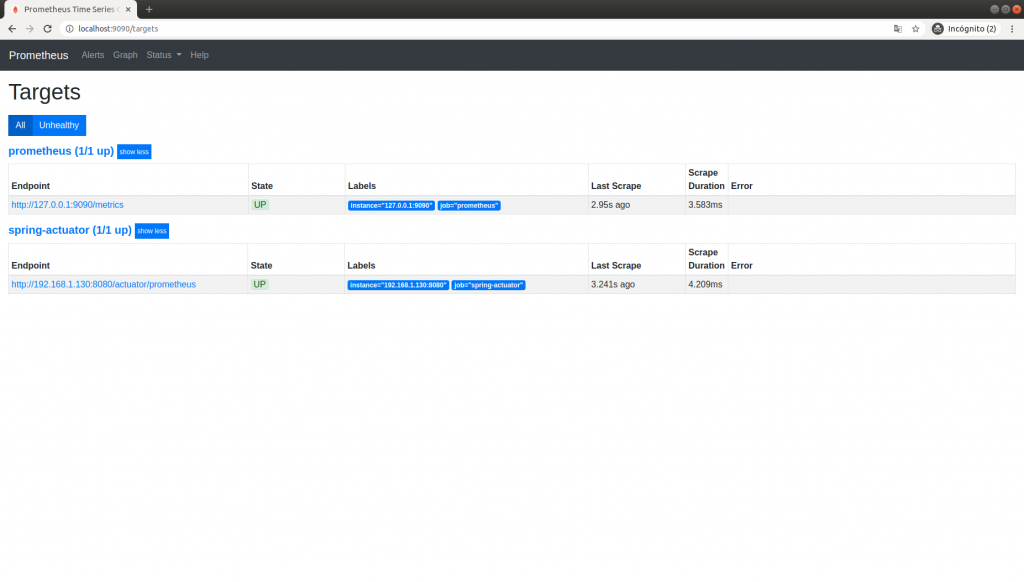
Now we have our application running with Prometheus. Next, we will connect Grafana to collect the metrics we are exporting to Prometheus.
Configure Grafana
Download Prometheus Image
Let’s download the Grafana image:
$ docker run -d --name=grafana -p 3000:3000 grafana/grafana
After running the Docker command, we can access Grafana by typing localhost:3000 in a browser. Remember that the default username and password are admin/admin.
Configure Grafana to Import Metrics from Prometheus
Once inside Grafana, in the right panel, click on Configuration/Data Sources and select Prometheus.
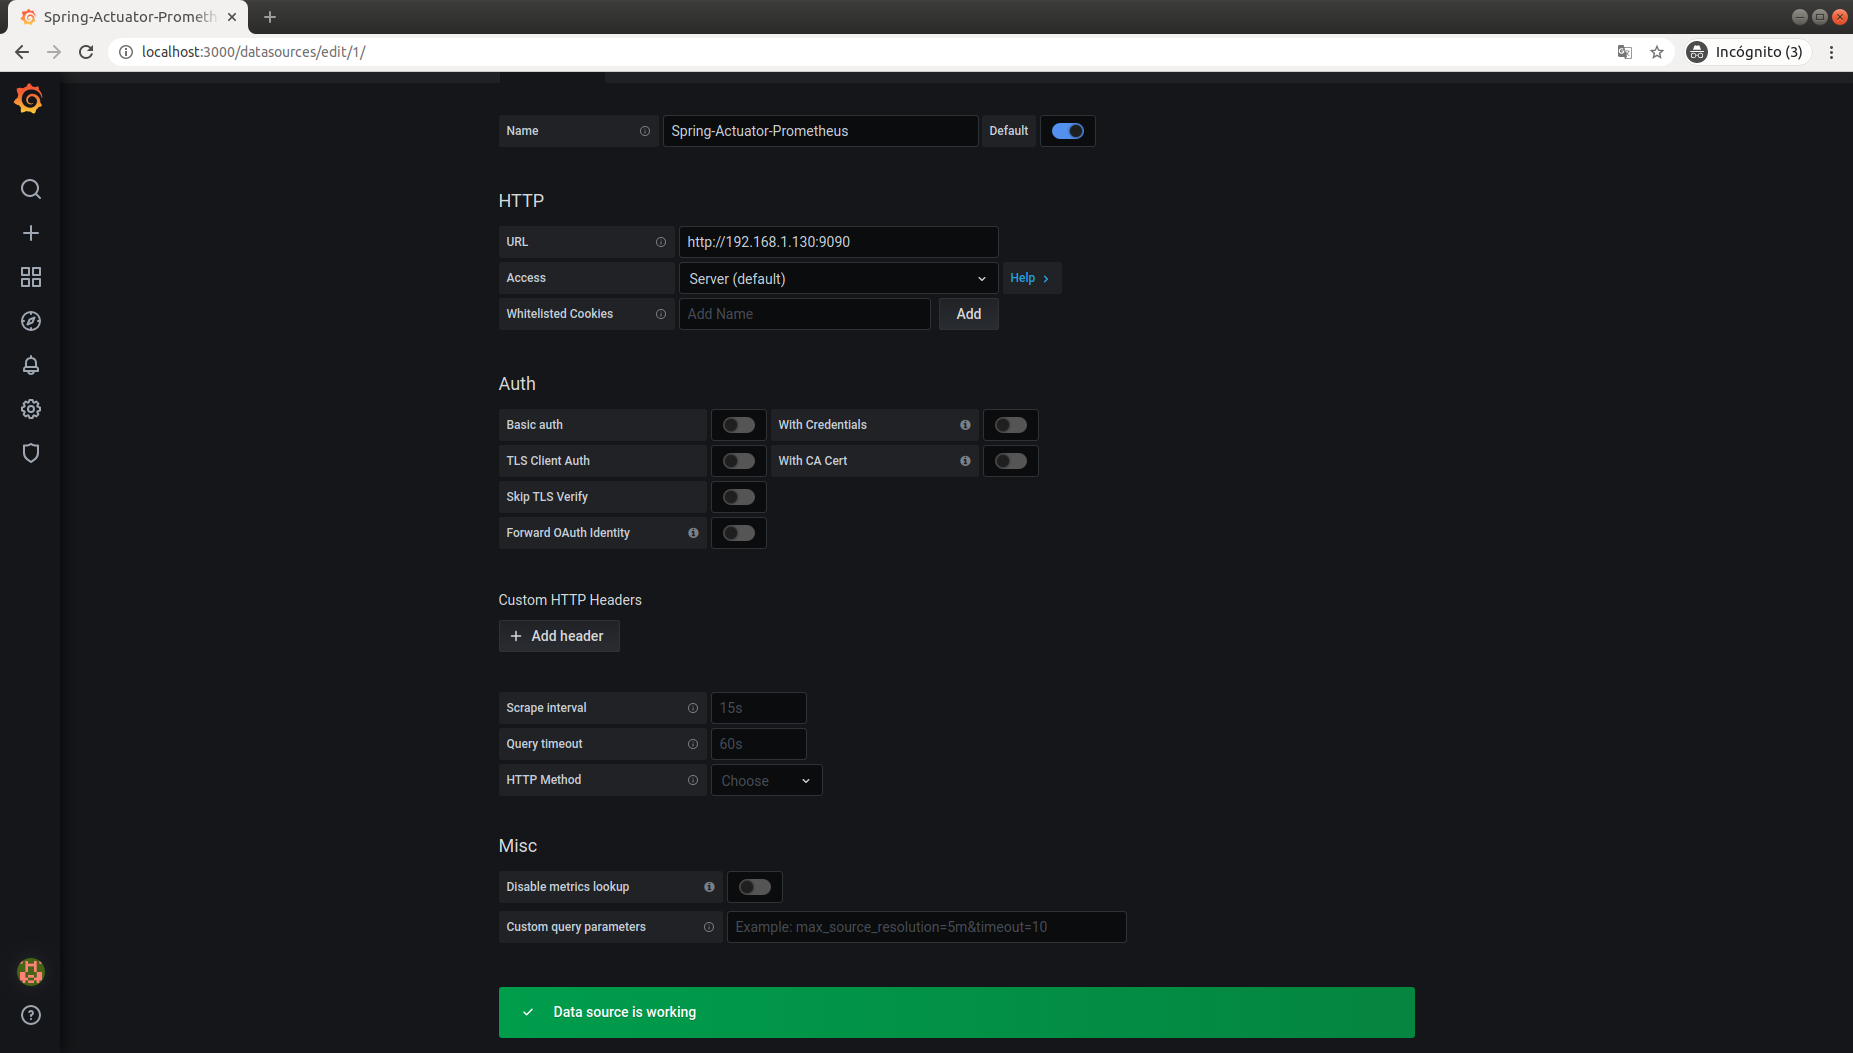
Create a Dashboard in Grafana
Click on the plus button in the right menu and add a dashboard. In the dashboard, set up a query. In our case, we added process_cpu_usage.
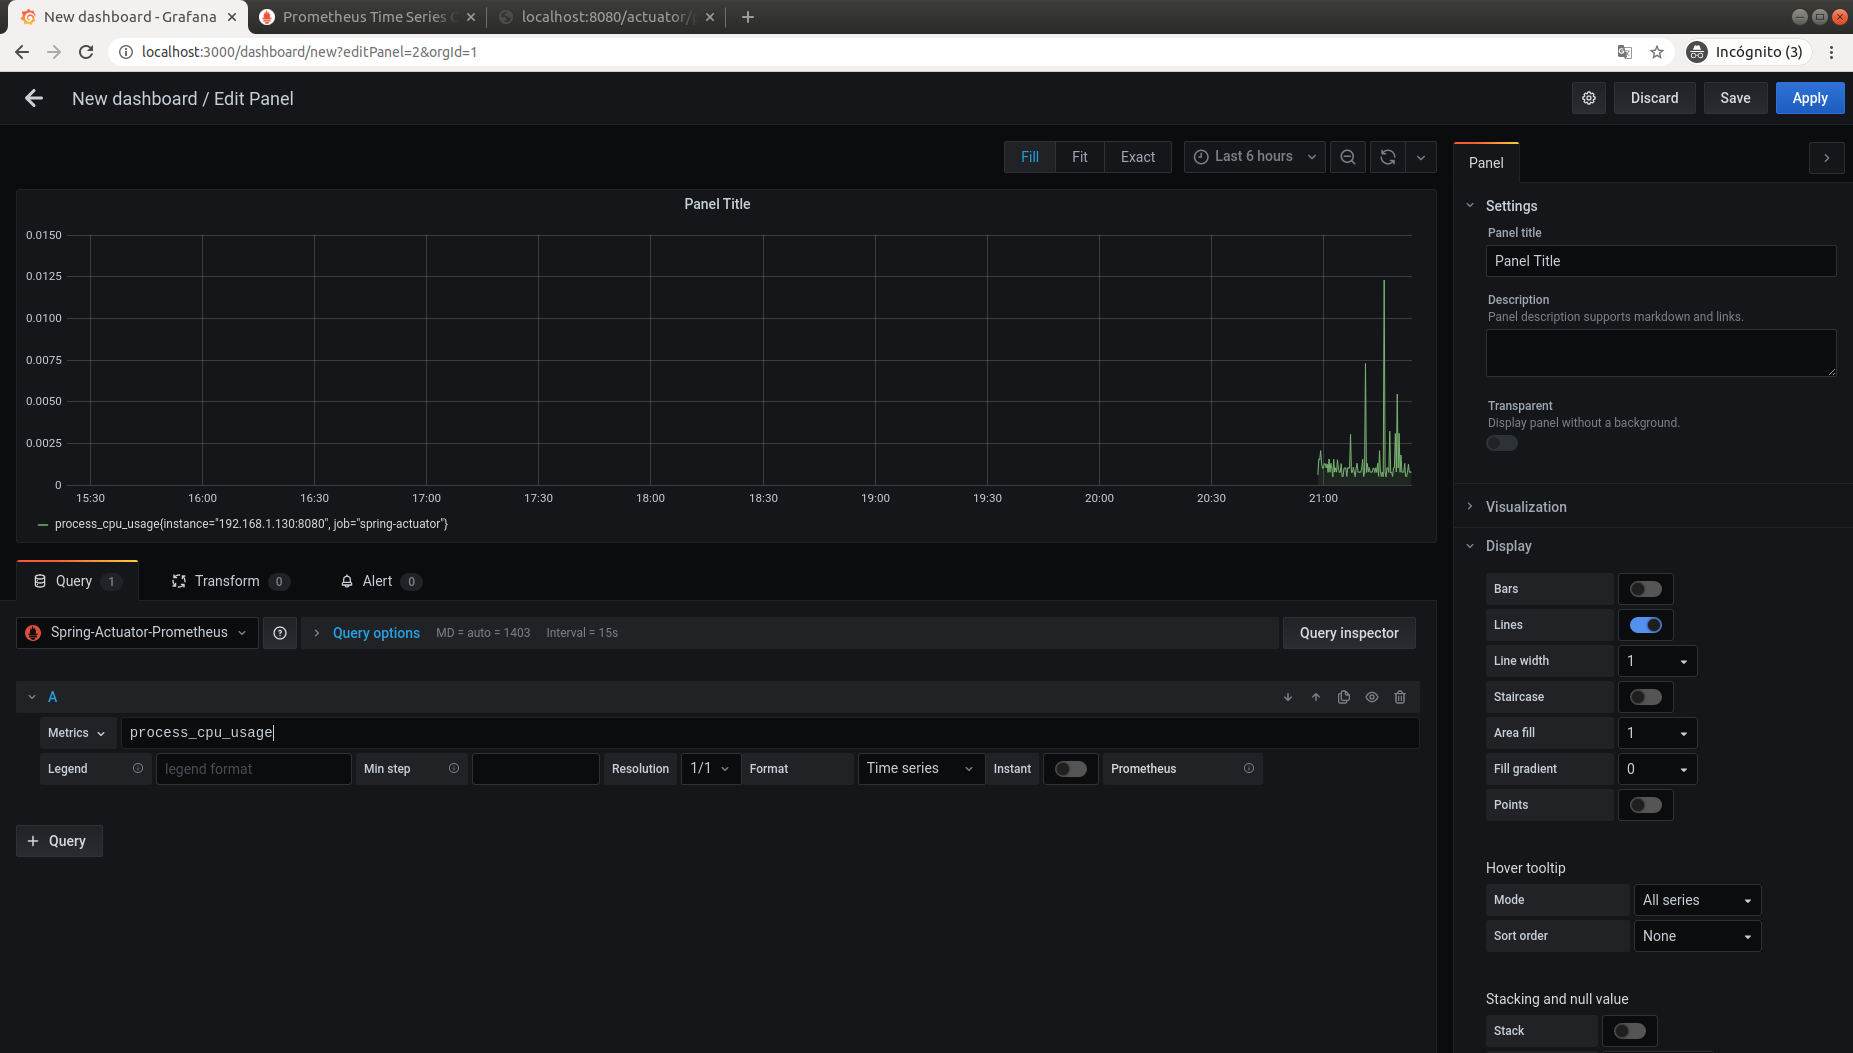
Save the panel, and it will appear on the main screen.
Conclusion
Spring Boot Actuator with Prometheus and Grafana is a good solution for visualizing metrics in an easy, intuitive, and dynamic way. As we have seen in the article, the configuration is not overly complicated.
All the necessary code can be found in our GitHub repository.
If you need more information, you can leave us a comment or send an email to refactorizando.web@gmail.com You can also contact us through our social media channels on Facebook or twitter and we will be happy to assist you!!
